

With the impending (or not) release of the Yeezy 2 Red Octobers, we are reminded simultaneously about all that is good and all that is bad in the realm of collecting sneakers. Nothing is quite as exciting as a release of this magnitude – hype that is typically doled but once a year. On the other hand, the chances of copping a pair at retail are between nil and negative nil point five (technical term). That leaves many looking to the resell market in the hopes of paying no more than one arm or one leg. In anticipation of that reality, now is the perfect time to take a deep retrospective on the Solar and Plats, and how the data can help us spot fakes.


For the purpose of this analysis, we’ve combined the two colorways. The data set, as always, is eBay auctions. In this case, it runs from the Yeezy 2 release in May 2012 through the first week of October 2013.
Yeezy 2 Volume Stats:
Sold Auctions:
- Total Pairs Sold (DS): 4,944
- Total Pairs Sold (Used): 797
- Total Pairs Sold (All): 5,791
- Deadstock Percentage: 86%
Unsold Auctions (ended with no sale):
- Total Pairs Unsold (DS): 3,284
- Total Pairs Unsold (Used): 794
- Total Pairs Unsold (All): 4,078
- Sold Percentage: 59%
All Auctions (Sold & Unsold)
- Total Pairs on the Market: 9,869
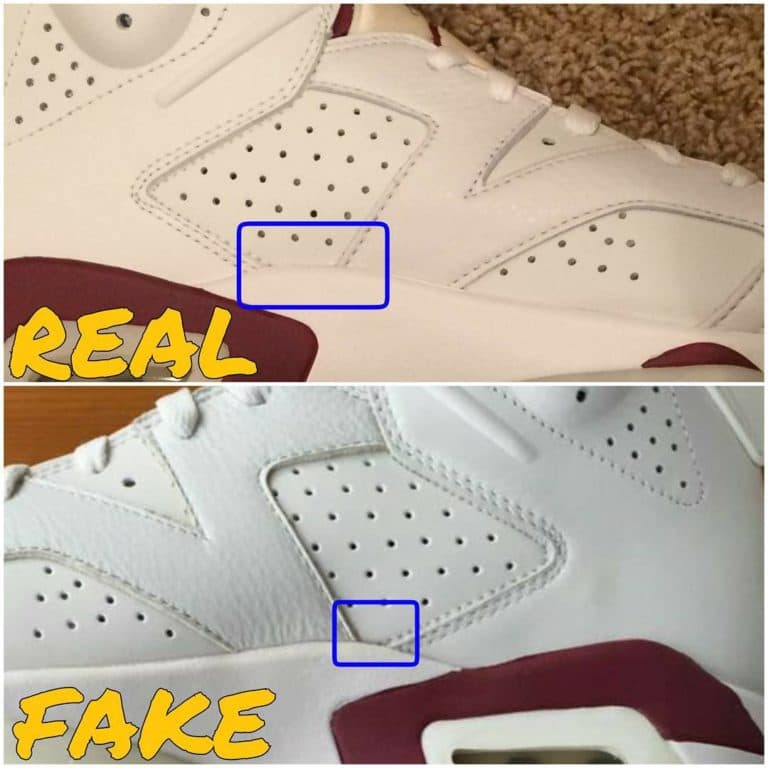
Note, unlike just about every other sneaker we have profiled on Campless, we have not listed any price statistics. This is intentional. Price is the big question with Yeezys – because of all sneakers sold on eBay in the past two years, perhaps no sneaker has seen more fakes . . . which makes this the perfect pair for us to explain the various methodologies we use to exclude fakes (and other data outliers) from Campless data, in general.
What are Data Outliers?
“Outliers” are auctions with an extreme sales price (either high or low) which should be excluded from our data analysis so that the statistics we publish, like average price, are not artificially impacted. Many outliers on the low side – those priced significantly lower than expected – are fakes. Outliers on the high side – those priced significantly greater than expected – are often auctions with multiple pairs. Of course, extreme prices can also be “junk” auctions – those where the real transaction took place offline or where no sale actually occurred. While only the fake analysis is directly relevant to consumers, it’s important to the accuracy of Campless statistics that both high and low outliers are removed.
Before we begin the Yeezy 2 analysis, let’s take a look at the summary price statistics if we were to not remove outliers. This will provide a nice comparison at the end of our analysis, after fakes, multi-pair auctions and junk are removed.
Yeezy 2 Price Stats (without removing outliers):
Sold Auctions:
- Average DS Price: $1,035
- High Price (DS): $90,300
- Low Price (DS): $0.01
- Average Used Price: $818
- High Price (Used): $98,900
- Low Price (Used): $0.99
Unsold Auctions:
- Average DS Price: $1,058
- High Price (DS): $9,000
- Low Price (DS): $0.01
- Average Used Price: $829
- High Price (Used): $9,999
- Low Price (Used): $0.01
Take a look at those numbers. Do any of them make sense? It takes neither a data scientist nor a sneakerhead to tell you that the auction that ended in a sale price of $98,900 is definitely an outlier – in fact, it was actually a pair autographed by Kanye, which we definitely don’t want skewing our data. Nor does it takes a Campless disciple to figure out that when an auctions “sells” for $0.01, the transaction either took place offline or it was complete junk.
So it’s clear there are problems with the raw data, but how do we fix it? How do we remove outliers and arrive at a data set that we can use to conduct analysis which will result in accurate statistics and meaningful insights? We’ll dive into that question in Part 2 . . .


