Since the very beginning of StockX, data and transparency have been at the very core of our business. It’s in our DNA. Remember when those Jurassic Park scientists drilled into an amber-encased mosquito, extracted the genetic material of some long-dead dinosaur, and created an amoral army of prehistoric killing machines? Well, if scientists ever did that to StockX, data and transparency is what they’d find. Those two ideas are fundamental to our business and our brand, and have been that way since back when we were Campless. They underlie everything we do – from the symbols on our stock ticker to the charts on our product pages. And now, we want you to join the fun. Enter the 2019 StockX Data Contest.
The first time we launched this contest was way back in 2017, and we’re excited to bring it back. The basic idea is this: we give you a bunch of original StockX sneaker data, then you crunch the numbers and come up with the coolest, smartest, most compelling story you can tell. It can be literally anything you want. A theory, an insight, even just a really original data visualization. It could be a novel hypothesis about resale prices you’ve always wanted to test. Or maybe it’s just a beautiful chart to visualize the data. It can be on any subject – sneakers, brands, buyers, or even StockX itself. Whatever you find interesting, just follow your bliss.
Once everyone submits their entries, we’ll go through and pick the most interesting and creative submissions. The winners will receive prizes, and the very best will get published here on our site and earn bragging rights for life. Here are the details:
The Data:
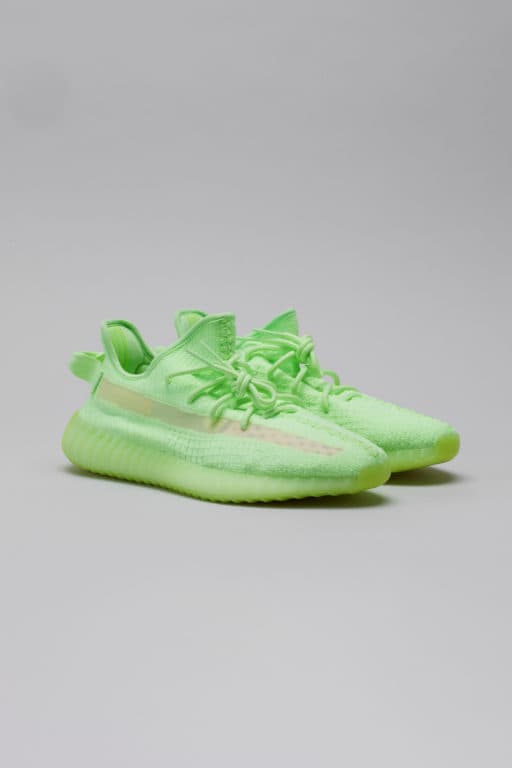
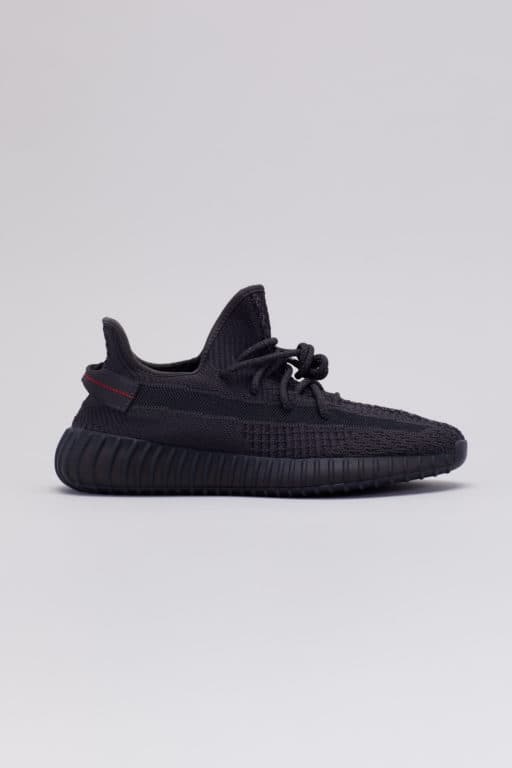
The data we’re giving you consists of a random sample of all Off-White x Nike and Yeezy 350 sales from between 9/1/2017 (the month that Off-White first debuted “The Ten” collection) and the present. There are 99,956 total sales in the data set; 27,794 Off-White sales, and 72,162 Yeezy sales. The sample consists of U.S. sales only.
Here is a link download the data
To create this sample, we took a random, fixed percentage of StockX sales (X%) for each colorway, on each day, since September 2017. So, for each day the Off-White Jordan 1 was on the market, we randomly selected X% of its sale from each day. (It’s not important to know what X is; all that matters is that it’s a random sample, and that the same fixed X% of sales was selected from every day, for every sneaker).
We’ve included 8 variables for you to work with: Order Date, Brand, Sneaker Name, Sale Price ($), Retail Price ($), Release Date, Shoe Size, and Buyer State (the U.S. state the buyer shipped to). You can use whatever variables you want in the analysis; you can use 1 variable, or you can use all 8. And remember, every row in the spreadsheet represents an individual StockX sale. There are no averages or order counts; this is just a random sample of daily sales data.
Prizes:
Prizes will be awarded based on the creativity, originality, and insightfulness of the analysis. The 30 most interesting submissions will get a custom StockX Data Contest t-shirt. And the top 3 winners will receive StockX store credit in the following amounts:
1st Prize: $1,000 credit
2nd Prize: $500 credit
3rd Prize: $250 credit
Even better, all three of the winning submissions will be published here on our site, so you can flex on all your friends. (For those who think sneaker data analysis and advanced visualization won’t earn you any clout, remember: nerds are cool now).
Submission Rules:
To enter the contest, simply run your analysis, create a chart, and then submit your work to [email protected].
Your submission should consist of a single file or folder with the following items:
-
- 1 chart or graph displaying your results. Do not exceed 1 chart
- A short write-up describing your analysis/results. Do not exceed 200 words
- One entry per participant
- Make sure all files have your name and email address somewhere on them
You may also include an excel workbook showing your work, though this is optional.
All work must be submitted by 11:59 PM on Friday, February 22th. Winners will be announced here on our blog 2-3 weeks later.
Most importantly, do not request any additional data. This is all the data provided, so don’t ask for more!
If you have questions, you can email us at [email protected]. But please read this post carefully before asking, because all the information you need should be here.
Here again is a link download the data
(And here is a link to a Google Sheets version, if that’s more convenient)
***
The is a huge data set packed with tons of interesting information. There must be a thousand different stories you can tell, and most of them we’ve never even thought of. So be creative.
If you’re looking for inspiration, you can always browse through our extensive catalog of data-driven blog posts, like our epic History Of Adidas Resell, our deep-dive into LeBrons, or our breakdown of last year’s Black Cement 3 release; or you can check out the winners of the original contest. But don’t let any of that limit you. We aren’t looking for copycats. We’re looking for originality.
Look forward to seeing what you come up with. Have fun!


