Three things in life are certain: death, taxes and end of the year ‘best of’ sneaker lists. Some of us have cheated death (hi Keith Richards) and others have definitely avoided taxes (hello Mr. President-Elect), but not even the best of us can escape every Tom, Dick and Hypebeast creating their list of best sneakers.
For the most part, we’ve steered clear of traditional participation in List SZN.
Back when we were Campless:
- For 2012, we published (in September of 2013) a list of the top sneakers with the most ‘staying power’ from the previous year. See it here.
- For 2013, we revived the staying power list, but got the post out by January. See it here.
- For 2014, we finally waded into ‘best of’ territory but, rather than create a list we collected 128 lists from others and synthesized the data in what is surely the most cerebral method of crowning the best shoe since Aristotle and Socrates debated Tevas vs. Birkenstocks. See it here.
- And by the time we got to the end of 2015 we were so immersed in building StockX (which would launch on Feb 8, 2016), that we didn’t even notice the year had ended.
But now that we’re a fully functioning ‘Stock Market of Things’, it’s time to reengage, the only question was how.
Then we saw @IcySoleOnline tweet this picture from @J23app with the caption: “156 pairs of Retro Air Jordan dropped in 2016 for total retail price of $28K”.
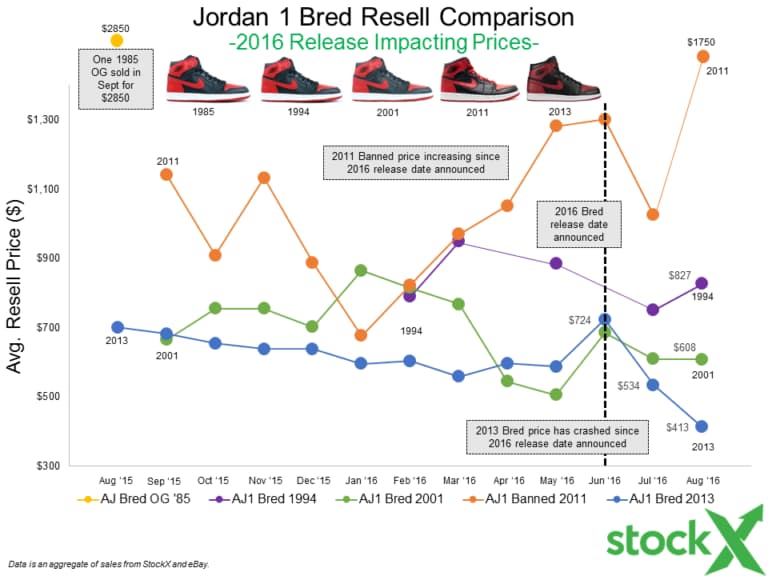
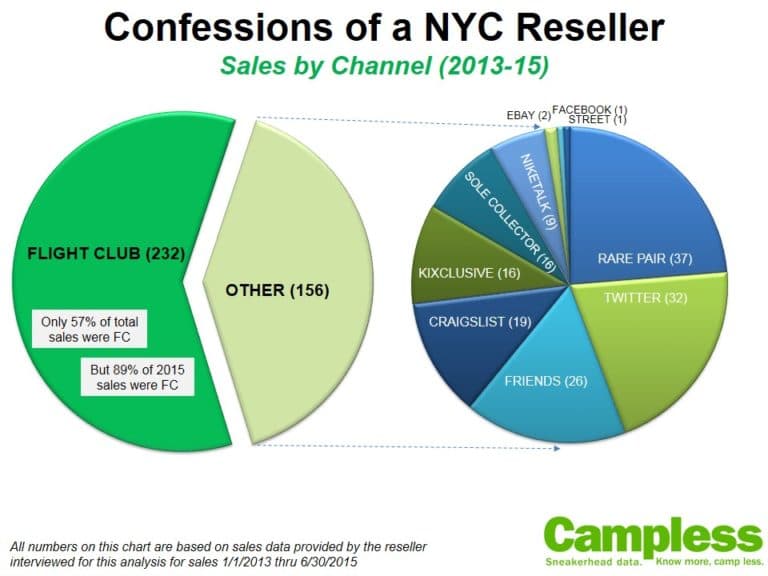
And it reminded us of this chart from The History of adidas Resell
 Actually, it also reminded us of every chart from Every Jordan Ever Released (served 5 different ways), but the point is that there were a lot of Jordans and a lot of NMDs released in 2016, and there are a LOT of different ways you can compare the data on the two.
Under normal circumstances, we would do a lot of analysis and create a bunch of charts and share a few insights. But we’re heads down on something special for January 14th (remember this date), so we’re going to let you do the work.
Here is a link to the raw data (2016 Jordans & NMDs)
There is a “ReadMe” tab and quite a few cell comments to help guide you through, but for anyone comfortable with Excel this should be relatively straight forward. This should be quite enough data to do some fun stuff.
Here, we’ll get you started.
StockX Insight:
There were 371 pairs of Jordans and NMD released in 2016. 92 had no sales on StockX. Of the 279 that had a sale:
- If you had purchased one pair of every Jordan (153) and every NMD (126), you would have spent $46,759 (Jordan: $28,355; NMD: $18,404)
- If you resold every one of those sneakers on December 28, 2016, you would have sold them for $68,646 (Jordan: $32,413; NMD: $36,233)
- Your 2016 profit would have been $21,887, a 47% ROI (Jordan: $4,058 – 11%; NMD: $17,829 – 82%)
- ROI ON NMDS WAS 7.5X GREATER THAN ON JORDANS
OK. Your turn.
Here is the link again: download the raw data
Do whatever analysis you want, create a chart with some insights and email it to [email protected].
Please submit back workbooks and any accompanying charts back in pdf/jpg format.
Last but not least, please do not ask for any additional data. The answer will be no, no matter how trivial the request is, or how easy it would be to pull. This is all of the data provided.
- Anyone who can show they’ve put some real work into it will get a free StockX t-shirt
- Great charts will receive a free StockX hoodie
- The best chart will receive $100 off their next purchase!
Submissions are due by 11:59pm ET, Friday, January 6, 2017.
If you have any questions, feel free to email our OG data specialist, Data Nerd at [email protected]
Enjoy!


