The most common criticism we receive about our Sneaker Price Guide is that some prices are too low. While it’s possible that we’ve made a mistake (and so we double check every sneaker that someone questions), more often than not the problem is not with our price, but with the sneakerheads’ perception of true value. We agree that many prices in our Guide are lower than we expected them to be. In fact, when we first started doing this work – way back in the summer of 2012 – we feared there was a problem with our data or methodology. So we reviewed thousands of sneakers by hand until we were convinced that many sneakers do, indeed, sell for much less than the “expected price”.
So we decided to prove it, mathematically.
Hypothesis: Sneakerheads think eBay is more expensive than it actually is
Conclusion: True. Perception is $46 more than reality for Jordans on eBay
The following is a complete explanation of the work done to reach that conclusion, broken down by our four key findings.
Data Criteria:
- We analyzed all Jordan Retros, 3 to 14
- We collected all eBay auctions (sold and unsold) for all DS mens Jordans over a 14 month period ending in May of 2013
- Each sneaker had to have at least 20 sales and 20 non-sales, or was excluded
- We identified six “time bins” related to the length of an auction: 0-1 days, 2-4 days, 5-7, 8-10, 11-20, and 20+
- Each sneaker had to have at least one sale and one non-sale in each of the 6 time bins, or was excluded
- 143 different Jordans qualified, resulting in 219,353 eBay auctions included in the analysis (119,976 sold; 99,377 unsold)
FINDNG ONE: THE BEST DEALS ON EBAY DISAPPEAR INSTANTLY
The first step was to study the price of auctions over time. To do so, we calculated the aggregate average price for the Jordan auctions (both sold and unsold) at six different points over time (“time bins”), correlated with the time it takes an auction to end. We also calculated the average price – the single “true market value” for all Jordans.
Average Prices of Jordan Auctions Over Time:
- 0 to 1 days: $278 (sold) $298 (unsold)
- 2-4: $284 $320
- 5-7: $286 $352
- 8-10: $305 $361
- 11-20: $334 $379
- 20+: $341 $398
- Total $289 n/a
When we plot these data points on a graph we can see a clear pattern and an interesting visual hypothesis as to why eBay auctions are perceived to be so expensive.
Key Insight: This chart shows that the lowest prices are found in eBay listings which end quickly. The first three points on the “Sold” line – those priced at or below average – actually account for 89% of all eBay sales. But the average sales price increases the longer it takes the eBay listing to end, whether the shoe is ultimately sold or not. The very clear upward slope is evidence that these deals disappear almost instantly, leaving “stale digital inventory” sitting for weeks. This has clear implications for three people: Buyers, Sellers and You
- Buyers: The lesson here is to ignore any auction which has been sitting for more than 7 days – odds are it’s overpriced and a better deal will come along soon. In fact, if you’re looking to save more than $10 you should really stop looking after the first day.
- Sellers: If your auction hasn’t sold after a week, it’s probably overpriced and you should consider lowering the price.
- You: If you’re reading this article, waiting for us to prove that eBay prices are lower than you think, the previous chart may have sparked your curiosity, but as an astute sneakerhead you are certainly thinking, “That’s all well and good Mr. Campless, but we still need a way to measure perception.”
FINDING TWO: OVERPRICED AUCTIONS ARE SEEN 5X MORE OFTEN THAN UNDERPRICED AUCTIONS
The way to measure eBay perception is not the volume of auctions at each price point, but rather how often people see a particular priced auction. This is best represented by the total number of days each auction spends on eBay. We can calculate this by taking the volume of auctions at each price point, multiplied by the average number of days the auction takes to close. The result is a percentage of total auctions seen for each price point/time combination. This allows us to measure perception.
Total Days on eBay = Avg. # days an auction is on eBay (time bin) * Volume of auctions at the average price
At an aggregate level, the 219k auctions we analyzed spent a total of 1.22 million days on eBay. When we plot the % of total days seen on the chart, and add up the time bins greater than the average, we get very interesting results:
Key Insight: Quickly adding the percentages in various locations relative to the actual market price provides several fascinating statistics, all of which support the hypothesis
- Overpriced auctions are seen 69% of the time, or 5.3 times more often than underpriced auctions
- Auctions priced at least $50 more than the average are seen 56% of the time, or 4.3 times more often than underpriced auctions
- Only 13% of all auctions seen are underpriced, and these are underpriced by, at most, $11 less than average
Starting to connect the dots . . . we’ve proven that low priced sneakers disappear quickly . . . which leads to “stale digital inventory” . . . so people see overpriced auctions more than five times as often as underpriced ones . . . presumably creating the perception that eBay prices are higher than reality . . .
The next step, then, is to actually quantify “perception price”. How much greater is the perception of eBay pricing than actual?
FINDING THREE: PERCEPTION IS $46 GREATER THAN REALITY
The statistical definition of “perception” is the price at which exactly half of the auctions seen are more expensive, and exactly half are less. We can quickly identify this point by creating a table from the data used to calculate “days on eBay”. When we sort this table in ascending order of price we can then calculate the cumulative % of auctions seen which – at 50% – will tell us the exact dollar amount of the “Perception Price”.
Key Insight: The Perception Price is $335. The actual price is $289. The difference of $46 (16%) represents how much more expensive people think eBay pricing is than reality.
- $46 is almost exactly how much the eBay & Paypal fees (14%) would be on a $335 sale (perception price). Many people already think sellers tack these fees onto the sneaker price, so this lends even more credence to the notion that sneakerhead perception is in line with the auctions they see. (Or it’s an absolutely ridiculous scary coincidence).
- This chart shows how we calculated the 89% of sales volume priced at or below average referenced previously in this article. We add the number of auctions from the first three rows (110,074) and divide by total number of auctions sold (123,443). Note, these 89% of auctions are only seen 31.7% of the time (3rd row, last column).
- This analysis does not take into consideration many other factors which could further increase a sneakerhead’s perception of eBay pricing, such as the shock factor of seeing one or two of these ridiculous auction stories, or any latent recollection of Flight Club’s pricing (which has a 20% commission tacked on top), or simply the constant chorus of talking (sneaker)heads who lament eBay by involuntary reaction.
- Bottom line: We at Campless believe the eBay price perception gap is much greater than $46, but that is the extent to which we have been able to show statistically.
FINDING FOUR: OTHER FACTORS IMPACT PRICE BUT DON’T CHANGE PERCEPTION
When considering the accuracy of our Price Guide, which is the calculation of eBay average pricing, there are a few other reasons why the data-driven price we report may be different than what you expect to see. Here are the top four:
Fakes vs. Lots:
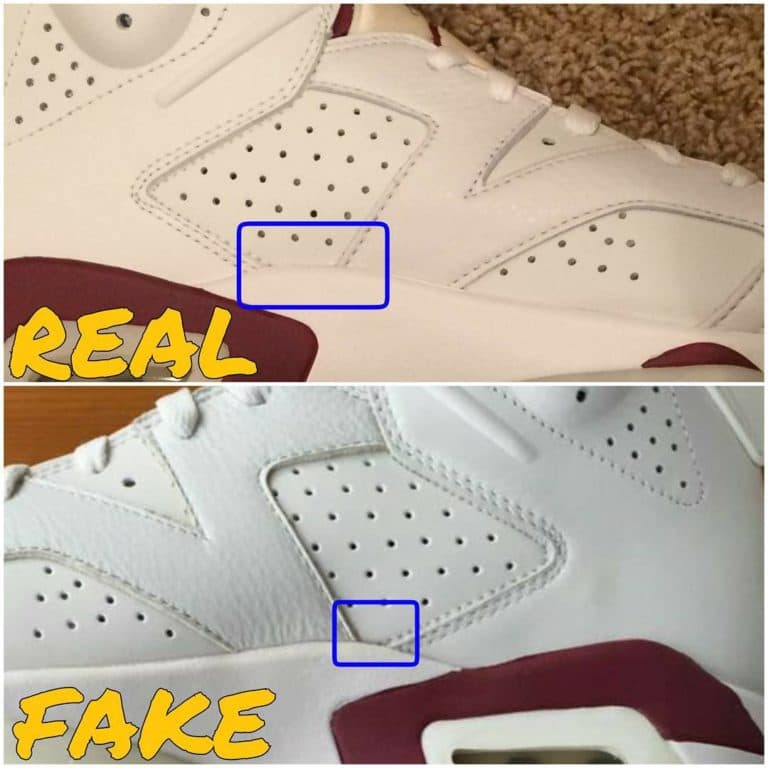
- Fakes: We take significant measures to remove fake sneakers from our data including: statistical outlier analysis, minimum & maximums, spot checking and, in the case of significant sneakers like the Yeezy, in-depth auction-by-auction analysis. Our four-part series on using data to spot fake Yeezys goes into great detail on the process. That said, it’s still possible that the rogue Fake finds its way into our data. In general, the inclusion of Fakes lowers the average price.
- Lots: “Lots” are auctions which contain multiple pairs. They are most often an issue when trying to price the individual sneakers from a pack. We use many of the exact same methods to eliminate Lots as we do for Fakes. And like Fakes, we eliminate the large majority of Lots, but some still slip through the cracks. When they do, the result is an increase of the average price.
- IMPACT: It’s possible that the high level impact of Fakes and Lots offset each other – one drives the price down, the other drives it up – leaving the price right back where it started. That is probably the case for any sneaker which is both part of a pack and highly replicated. But we err on the side of exclusion – if there is any question, we exclude the auction. So the reality is that when looking at 8.8 million auctions, the very few Fakes and Lots which slip by have a negligible impact on average price or other Campless statistics.
Volume vs. Volatility:
- Volume: The average price of a high volume sneaker (the Gamma 11s, for example, sold 12,066 pairs since release) is, in general, more reliable than a sneaker with low volume. Simply put, the more auctions, the lower the chance the price is negatively impacted by “bad” data.
- Volatility: Price volatility (defined as standard deviation divided by average price) is a measure of how much you can expect the price to deviate from the average. Simply put, the greater the volatility, the wider the range of expected price. The lower the volatility, the more confidence you can have in the exact average price.
- IMPACT: When reviewing the Campless Price Guide, which now includes sales volume and price volatility, remember that higher volume and lower volatility means you should have higher confidence in the exact price listed. Lower volume and higher volatility are indicators to expect a larger range around the price listed. For more information on volume, volatility and other statistics we use to extract meaning from sneaker data, see: “Sneakerhead Statistics Defined“.
Fakes, Lots, Volume and Volatility are important concepts for our work. The manner in which we account for these factors is just one of the reasons the Campless methodology can be trusted, and why data analysis is inherently more accurate than the “expert knowledge” of any individual. It also helps explain why your perception of eBay pricing is not as accurate as our data-driven analysis of it. How many auctions have you looked at? 100? 1,000? Even 10,000? Let’s say you do nothing but search eBay all day, every day and you’ve actually seen 100,000 auctions. Great, just 8.7 million more to go.
IN SUMMARY:
- The best deals disappear immediately. 89% of eBay sales are priced at or below average, but these auctions disappear within a few days, leading to “stale digital inventory” which sits for weeks, some that never sell.
- Expensive auctions are seen the most. The result of “stale digital inventory” sitting for weeks is that overpriced auctions are seen 5 times more often than underpriced auctions.
- The perception gap is at least $46. Quantifying the “stale digital inventory” phenomenon into dollars, perception is that Jordans are at least $46 more expensive than reality, not counting the unmeasurable impact of extreme auctions.
- External factors don’t impact perception. Fakes, Lots, low volume and high volatility all play a part in the accuracy of any one auction. However, traditional data analysis techniques combined with almost 9 million auctions ensures that these factors have nominal impact on aggregate sneaker statistics.
Finally, in the interest of boiling it all down to one simple chart, here’s one to show your friends:
All that said, please keep checking our work. If you see a price that doesn’t look right, let us know. We’ll double check it. I mean, we’ll probably refer you to this post again, just to make sure you’ve done your homework, but we’ll always double check ours.


