

We started collecting eBay sneaker auctions in April in 2012. Since then we’ve been analyzing the data, calculating average prices, testing random hypotheses and generally playing with small cuts of the larger sneaker market. Here, for the first time, is an aggregate view of the entire eBay sneaker market (sneakerhead and Monarch-head alike) over the past two years.
Data Set: Every sneaker sold on eBay from May 2012 – April 2014: every condition, every size, every gender, every brand
Methodology: Three primary data points
- Total Dollars: All money paid by buyers, in exchange for sneakers, which includes sales price, shipping and fees. This has been a frequently asked question and we strongly believe this is “true market value” for two reasons: 1) a buyer doesn’t care where the money goes; he or she parts with X dollars and receives 1 pair of sneakers; and 2) there are selling costs associated with every channel
- Total Pairs Sold: Do we really need to define this?
- Average Price: Total Dollars divided by Total Pairs Sold
On one hand, the results are not surprising- the resell sneaker market has grown a lot. No shit. On the other, it’s still impressive, particularly when seen like this. Is the sneaker resell market the fastest growing thing in the world? Well, we don’t have data on anything else, so we assume yes…
Yearly Stats
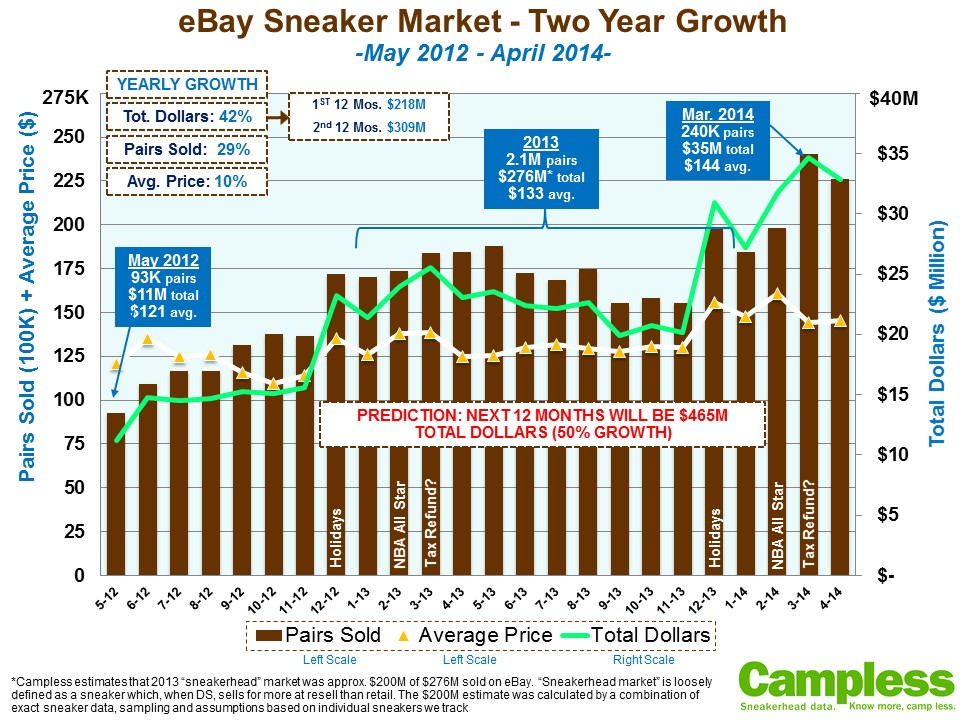
- Past Year (May ’13 – Apr. ’14): 1.7M pairs sold. $218M. Avg price $127
- 2013 Calendar Year 2.1M pairs sold. $276M. Avg price $133 *(FN1)
- First Year (May ’12 – Apr. ’13): 2.2M pairs sold. $309M. Avg price $139
Although we include shipping fees in Total Dollars, it’s interesting to note that of the $309 million over the past 12 months, $12.5 million was allocated to shipping
Yearly Growth (from first year to second year)
- Total Dollars: 42%
- Pairs Sold: 29%
- Average Price: 10%
By looking at Pairs Sold and Average Price next to each other, we can clearly see that the majority of market growth is driven by more pairs as opposed to higher prices. It’s also worth noting that the retail sneaker market grew by 5% in 2013 (according to Matt Powell), so that has some impact, as well.
Monthly Growth (average of month-to-month growth rates)
- Total Dollars: 5.9%
- Pairs Sold: 4.4%
- Average Price: 1.1%
5.9% monthly growth is the value you get when using a straight monthly average. However, our goal is to be able to predict growth, so a more nuanced analysis is appropriate. We tested four alternate growth formulas*(FN2) and ultimately decided on the one which accounted for all of the following factors:
- We need a forward-looking growth rate, not historical
- The first month (May 2012) was excluded, as it is a statistical outlier
- The rate of growth is decreasing
- The new formula utilizes monthly compounding growth
PREDICTIVE MONTHLY GROWTH RATE = 2.5%.
While it’s accurate to say that monthly growth over the past two years averaged 5.9%, we predict Total Dollars will grow at 2.5% per month over the next year.
Additional Key Insights:
- As mentioned above, the rate of growth is decreasing. While Total Dollars is still growing, it grew faster during the first year (4.34% monthly) than it did during the second (3.07% monthly). This helps explain why the predicted growth rate (2.5%) is less than historical (5.9%)
- Not surprisingly, the largest month-to-month growth occurred from November to December each year. In 2012, Pairs Sold grew 26% and Total Dollars grew 49%. In 2013, it was 28% and 53%, respectively. Obviously the holidays drive this, suggesting that the resell sneaker marketplace acts just like every other retail channel in this regard
- On the other hand, the two largest month-to-month declines were Aug-Sept 2013, and Mar-Apr 2014. To figure out why, we opened a release calendar:
- Last September, there were no significant Nike drops. The biggest Jordan Brand releases were the crowd pleasing, but limited, Jordan V Doernbecher and Jordan 3Lab5. With such limited new supply on the market, low resell numbers make sense
- The second decline is more difficult to explain. We had several decent-size sneaker events in April 2014, including the general release Jordan Barons Pack and the Eastbay big-footer restock – so it’s a little odd to have such a sharp decline. But remember, the flip side of any decline is outstanding performance the month before: March 2014 led all months with the most Pairs Sold and most Total Dollars. Perhaps this is indicative of a larger issue . . . can someone say “tax refund flexing”? Read on . . .
- March was repeatedly the highest performing month for each trailing 12-month time frame. So why is March such a big month? One dual-headed theory is the combination of the largest and most popular pack of the year (NBA All-Star Game) with tax refunds. We have no other data to support the tax refund theory, but it’s certainly a real phenomenon in many other industries. And as mentioned above, resell sneakers are already showing very real signs of conforming to traditional U.S. retail industry patterns around the holidays, so no reason to doubt tax-refund spikes wouldn’t occur, as well.
CAMPLESS PREDICTION: As explained above, we predict eBay sneaker Total Dollars will grow 2.5% per month for the next year. This will culminate in estimated sales of $44 million in April 2015 and Total Dollars of $465 million for the next 12-month period (May 2014 to April 2015). When compared to the $309 million this past year, that implies a year-over-year growth forecast of 50%, a slight increase versus the 42% this year.
What do you think? Like our prediction? Do you think the Nike hype machine will kick it up a notch, resulting in Apache Chief-like growth and maybe top $500 million? Or will the (Air Max) bubble burst and we fall back down to pre-Galaxy levels?
Footnotes:
1. Total Market ($276M) vs. Sneakerhead Market ($200M). We have previously, publicly estimated the 2013 eBay “sneakerhead” market at $200 million. The above data shows $276 million for 2013. The difference is that the $276 million includes more than just the “sneakerhead market” – which we loosely define to include sneakers which, when deadstock, resell for more than retail. $76 million is, therefore, the “Monarch-head market” – an obviously made-up term for the non-sneakerhead sect. We calculated the $200M sneakerhead estimate by a process of sampling, combined with assumptions derived from data on individual sneakers tracked by Campless. A full explanation of this calculation will be the subject of a future post. Similarly, we have previously, publicly estimated that eBay represents one-third to one-half of the total sneakerhead market. As with the above note, we have intentionally avoided that issue here, as it is also a topic for another post.
2. Monthly Growth – Alternate Formulas. The four methods, and resultant growth rates, are:
- A revised straight monthly average, but without the May 2012 outlier [4.8%];
- A simple CAGR, where we’ve adopted the yearly CAGR formula (compound annual growth rate) and set each time period equal to one month, giving us a monthly growth rate that compounds [3.7%];
- A statistical CAGR, which takes the simple CAGR adds an exponential trend line fitted to actual monthly sales [3.5%]; and
- A four month CAGR, which is based off the average of the most recent 4 months of rolling 12-month “monthly” growth rates, which takes into consideration the fact that the rate of growth has been slowing over the past two years [2.5%]
Number 4 was used.
Don’t forget to take our Sneakerhead Survey and contribute to a better understanding of our community.


